
Where do elite high school students live?
Our work is based on pillars that contribute to a safer, healthier, more prosperous society for everyone, including the belief that open data should be cultivated and made public for the benefit of communities and society in general. “Open data is data that can be freely used, re-used and redistributed by anyone - subject only, at most, to the requirement to attribute and sharealike.”
We also believe in the value of looking at environmental and social outcomes from a location perspective. We created the maps below to provide simple glimpses into the admission using open data provided by New York City, the US Census and other sources.
“Opportunity and Equity in NYC: A preliminary paper on the relationships between Neighborhood, Middle Schools and Admission to NYC’s Specialized High Schools”
What is the problem?
Black and Latino students, who make up 70% of the city school system, received 9% of offers for the 2021-2022 school year.
In 2018, only 4% of all Black students received offers while 6% of all Hispanic students received offers.
NYC’s former Schools Chancellor Meisha Porter blamed the low numbers on the fact that admission is based solely on a single qualifying exam and advocated to repeal and replace the exam with a “more equitable” process. We agree the education system is due for an overhaul But we also believe the systemic equities go beyond the test. Preparation for high school begins at the earliest age and every step in the process influences who is advantaged and who is likely to succeed in competitive environments.

Consider the pipeline
We need to take a deeper look at our City’s education pipeline, starting with the middle schools that are sending students to academically rigorous high schools. Identifying the feeder schools means we should also look at the neighborhoods surrounding the school. Because, unlike New York’s high schools, middle schools are still predominantly attended by students who live within the school district.
We need to look at the socio-demographic trends within and between districts and neighborhoods. And if we can identify the schools likely to send students to academically rigorous high schools, we can also identify the schools less likely to prepare students for further rigorous education.
For example, the map on the right shows NYC school districts color scaled by the density of 8th grade students, calculated via dividing total student population by the number of middle schools within that district.
The Mayor and Chancellor and City Council members can change policies around high school admission and enrollment. If they have the political will, they can allocate more tax dollars to provide learning resources to bridge learning gaps. They are limited in terms of controlling family environments and personal choices, but they have abundant control of publicly funded school environments and other learning opportunities within each neighborhood including City Council District and Community School District.

Location Matters
Can we use the larger community and neighbourhood location as a place to compare the educational pipeline and trajectories? Moreover, can we identify opportunities in neighbourhoods to consider environmental factors that contribute towards education outcomes and as a way to think about scaling opportunities for creating equity?
Are students with offers attending a random selection of middle schools? Are they coming from schools equally distributed in neighbourhoods all over the five boroughs?
The answer is a clear no. An overwhelming majority of middle schools get no or very few offers (See red indicators in the map on the left). In 2021 only 17% of middle schools had six or more students who received offers.

The dark blue icons indicate where the top 20 schools with the most offers to Specialised high schools are located.
The map also shows each community school district according to a scale of red to green with the darkest red districts having the lowest percentage of offers for test takers and the darkest green having the highest percentage of offers to test takers.
We can clearly see there’s a pattern by borough.
District 2 in Manhattan and District 26 in Queens tie with the most middle schools (4 each).
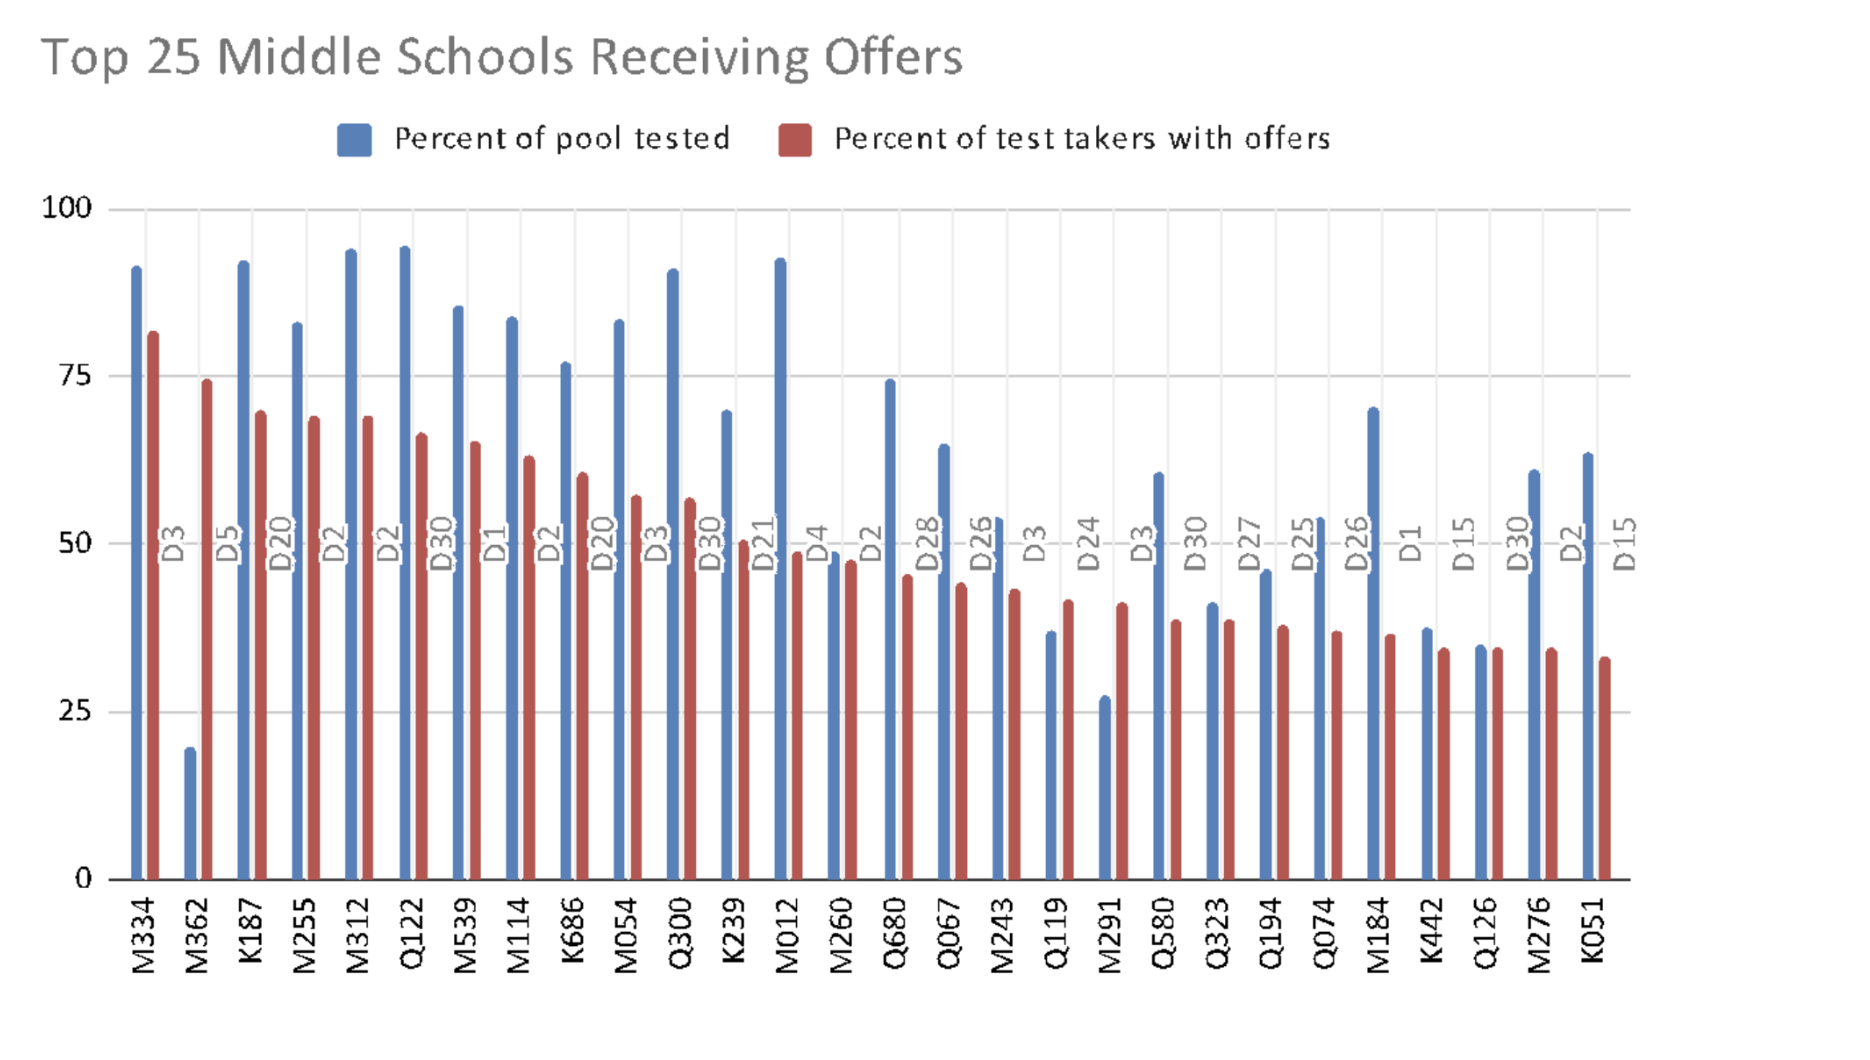
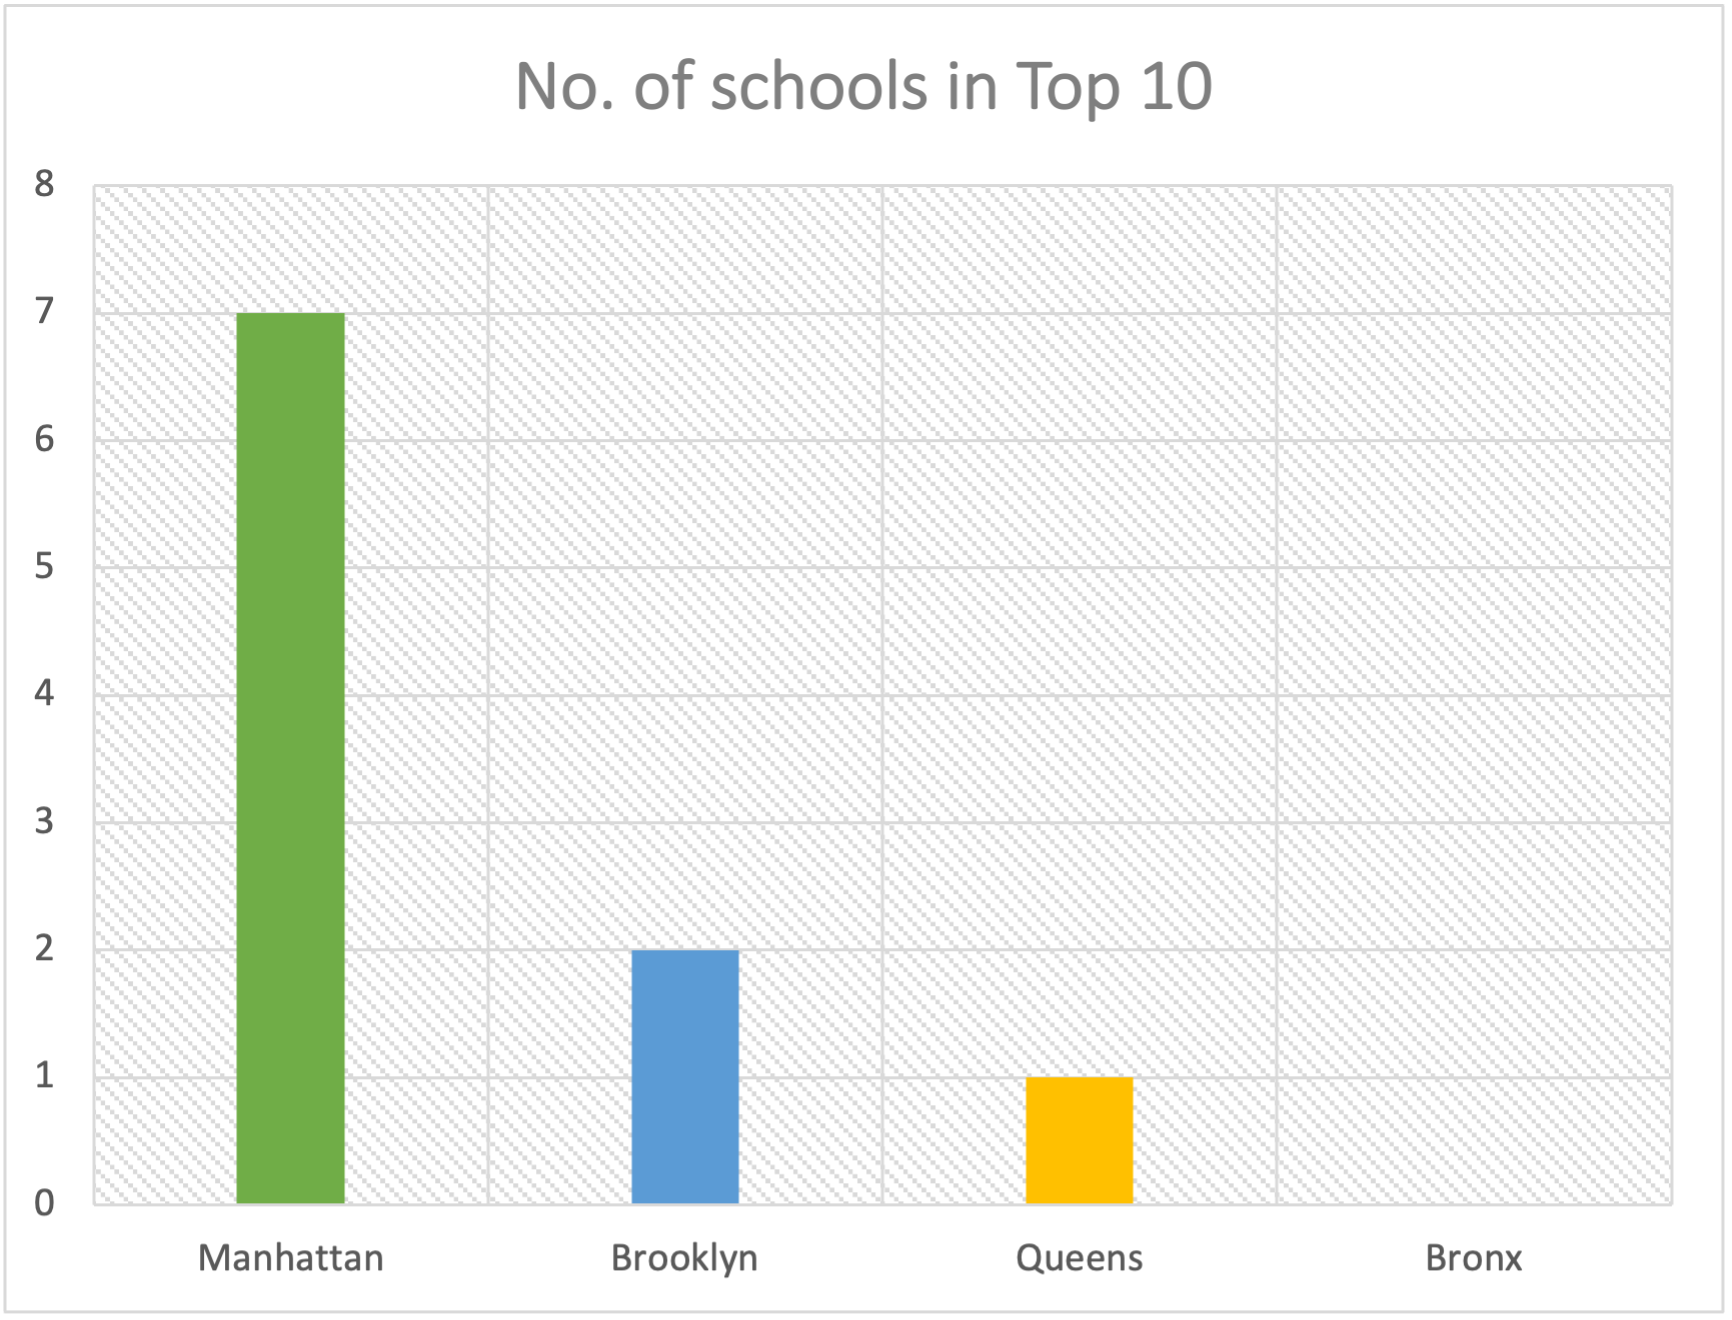
Convincing students to sit for the two-hour test is part of the challenge. Of the schools with the greatest percentage of test takers (between 84% - 94% of all 8th graders), six are located in Manhattan; two are in Queens; one is in The Bronx and one is in Brooklyn.
Where are the schools with the highest % test takers located in NYC?
Preparing communities to succeed
Interestingly, the school in the Bronx where 92% of the students sat for the test is a charter school: South Bronx Classical Charter School II (84X364). The test pool of only 12 8th graders was extremely small with five or fewer receiving an offer.
And of the two schools in Queens, P.S 122 Mamie Fay in District 30, had the highest percentage of test takers with almost 95% of 95 8th graders taking the test.
On the other hand, the school in Brooklyn (Christa Mcauliffe School /I.S. 87 in District 20) with the 2nd highest percentage of offers (70% of all test takers received offers) was also the 4th highest school in the City in terms of test takers (92.6%). This school had the largest class of 8th graders by far with 340. This school might be an anomaly but perhaps there are best practices we could learn from their experience.

What’s next?
A major challenge in our statistical analysis is the fact that schools with 5 or fewer students receiving offers or taking the test do not report absolute numbers to protect student privacy. In 2020, 83% of schools reported having 0-5 offers going to their students; 21% of middle schools report 0-5 students sitting for the test.
We are hoping to receive test results that account for schools with zero test takers or offers versus those with one or more in order to show a more accurate picture of schools and neighbourhoods where the attempt to participate in the rigorous and highly competitive high schools exists and where it may be completely absent.